More than a year ago I wrote a series of posts titled "Following the Money" that examined the breakdown of Sport Canada's overall contributions to all recipients, and the percentages allocated to Olympic sports. I went looking for the 2003-2004 and 2004-2005 numbers on the Sport Canada website so that I could update the charts I did then.
Regular readers and people who work in the Canadian sport system will know that Canada's sport funding partners have recently made a change in their funding strategy. The old strategy, sometimes described as "a mile wide and an inch deep," was to distribute funds to a large number of sports in more or less equal measure. The "inch deep" part of that metaphor comes from the recognition that the total number of dollars available is fairly small, so a wide distribution means less for everybody — and perhaps not enough for anybody.
The new strategy adopted by Sport Canada and the Canadian Olympic Committee is intended to target funds where they will give the most benefit and are being best used. For high-performance funding, that means giving more money to sports with a high probability of future Olympic success. A few weeks ago I wrote about the Canadian Sport Review Panel's allocations for summer sport high-performance funding and assessed how the highest-ranked sports have done. Here I want to take a look at funding in the broader picture and take a look at the new strategy in the context of the past decade.
Figure 1 (inset) shows the updated chart of Sport Canada contributions, divided into more or less the same categories as last time. I made a few minor adjustments; for example, I made Olympic and Paralympic sports into a single category. For the most part, that's because it's actually not easy to separate them. National Sport Federations (NSFs) like Athletics Canada get funding for Olympic and Paralympic programs, but the Sport Canada summaries just provide totals.
The first conclusion we can draw is that the Sport Canada budget has seen a strong increase — about 160% — over the past decade. Aside from the International Events category, which tends to wax and wane depending on which events Canada is hosting in any given year, every category has seen a steady increase. The Olympic/Paralympic Sports category represents the total funding given to NSFs for Olympic and Paralympic sports, plus a few multi-sport organiations (MSOs) dedicated to high-performance sport, such as the Canadian Olympic Committee and Canadian Paralympic Committee. That amount has increased from $21M to $51M since 1995-96. The contribution to the Athlete Assistance Program, which goes directly into the hands of national team athletes, has similarly increased from $10M to $20M.
That's all very good news for Canada's elite athletes, and for sport in general.
Figure 2

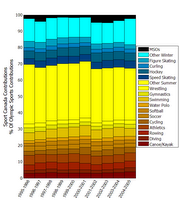
Figure 2 — Sport Canada funding distribution for Olympic and Paralympic sports, 1995-2005 (click to enlarge).
Figure 2 (inset) shows more detail about the Olympic/Paralympic Sports category, and the results were somewhat surprising to me.
Here the plot shows the distribution of funds to Olympic and Paralympic sport organizations. Each bar shows the Sport Canada contribution as a percentage of the total in the Olympic/Paralympic Sport category each year. (Recall that the total has increased from $21M in 1995-96 to $51M in 2004-05.) What this should show us, then, is whether any recipient or group of recipients has been recieving a bigger or smaller piece of the (growing) pie.
I've identified specifically a small number of NSFs for summer and winter sports in the chart. For summer sports, I singled out the NSFs responsible for the twelve top-ranked CSRP sports on my previous report card. Remember that these eleven NSFs fielded teams that won eleven of Canada's 12 medals in Athens, and the CSRP is predicting that they will be responsible for 17 of 20 medals in Beijing. For winter sports, I have broken out the four NSFs responsible for the Own the Podium program's top-priority sports.
The surprising results show that these "have" sports have not significantly changed their share of the total contribution. The eleven summer sports in question took in 33.1% of the total Olympic/Paralympic funding in 1995-96, and 35.6% in 2004-2005. The high point of 36.8%, curiously, was 2000-01, which also saw a big increase in the total funding. The top four winter sport NSFs saw 14.2% of the total in 1995-96, and 14.5% in 2004-05. The highest percentage (16.0%) was allocated in 1997-98.
There has been a slight shift towards winter sports overall of about 2%, with the decrease coming out of summer sports.
So what does this all mean? Is targeted funding just a myth?
Well, maybe. There are a couple of confounding factors here. The first is that several of these "high-priority" NSFs have somewhat split personalities. For example, Canoe Kayak Canada gets funding for sprint canoe-kayak, which is a CSRP 1A sport, and for slalom canoe-kayak, which is in category 4. The Sport Canada contribution represents the total for everything, so an increase in sprint funding might be masked by a decrease in slalom funding.
A more fundamental difficulty with these numbers is that they represent contributions for domestic programs, including grass roots development, and not just for high performance sport. In many cases the high-performance budget dwarfs other contributions, but in other cases it does not.
However, the results still surprised me. I expected to see the top-priority sports taking a bigger share of the pie over the last two funding cycles. I think what we're seeing here is the fact that Sport Canada has mostly avoided having to make the tough decisions because of the overall increase in its budget. When there's more money to go around, they can increase budgets for the high-priority sports without having to make a lot of painful cuts elsewhere. It will be interesting to see how the targeting strategy plays out when budgets start shrinking again.


No comments:
Post a Comment