Are you ready for more fun with the IOC Programme Commission Report? In case you've forgotten, that's the document that the IOC produced this spring evaluating each of the 28 summer Olympic sports, plus five other recognized sports (Roller Sports, Golf, Rugby, Squash, and Karate), prior to the big programme review and sport elimination vote.
Of course the actual vote had almost nothing to do with the evaluation report, but it has a lot of interesting information in it, anyway. As I previously noted, one of the evaluation criteria is an assessment of each sport's anti-doping effort. At the back of the report is a table that documents the number of tests performed, and the number of confirmed positive tests, for each of the 33 IFs.
Here's a little trivia question for you: out of the 28 summer Olympic sports, plus the five recognized sports, which one had the highest rate of positive tests?
The answer would have to be athletics, right? Athletics reported that 0.64% of tests in 2003 showed doping violations, which is pretty high, but that wasn't the highest reported rate. It wasn't weightlifting (0.50%), cycling (0.49%), or aquatics (0.20%), either.
The winner was Golf, with an astonishing 1.67%. And as far as I can tell, the IF in question (the IGF) has no jurisdiction over the professional golf tours, so these would have been largely amateurs. Actually, three of the proposed sports (Golf, Karate, and Roller Sports) finished in the top 5, and Rugby was 8th. Athletics was 6th, and the third-highest among current Olympic sports. The highest among Olympic sports (and second overall) was Baseball, at 1.24%, followed by Archery, at 0.88%. These are all fairly surprising results, in my opinion. I was even somewhat caught off guard by the high rate in baseball; remember, these are tests administered by the IBAF, which has no jurisdiction over major league baseball and its steroid problems.
So what's behind these surprising results? Is drug use really rampant in amateur golf, at two and half times the rate of athletics?
Well, maybe. But I suspect that there's a more mundane reason for the odd results: small sample size. Whenever you sample a population (athletes) to calculate a rate of incidence (rate of doping), you're in fact making an estimate of the actual rate of incidence. That estimate comes from an underlying probability distribution, which implies a confidence interval associated with the estimate. If we want to convert the measured number of positive tests into a doping rate, we should also note the uncertainty in our estimate. The IOC table gives the percentage of positive tests, which is a legitimate estimate of the rate of doping in a sport; however, it does not address the issue of uncertainty.
In this case, we can estimate the uncertainty in the estimates of the doping rate by making some simplifying assumptions. Let's assume that the actual rate of doping in a given sport is p, and let's further assume that the tests are absolutely perfect — they catch every cheater, and never give any false alarms. (I'll discuss this second assumption a bit more later.)
If we test M athletes from the population, we would expect to find k = λ ≡ pM positive tests. In fact, of course, even with a perfect test we would not find exactly λ positives every time, due to the random nature of the sample; there is a non-zero probability that we would find k = λ ± 1, λ ± 2, etc. The probability distribution for k is described by the binomial distribution, which is nicely described in this Wikipedia article. We could use the binomial distribution directly to estimate the uncertainty in our estimate, but I'm going to make a few more simplifications until we get to the point where I can do the calculation on the back of the proverbial envelope.
It turns out that if positive tests are "rare," which they are, then the binomial distribution will approach the Poisson distribution (Wikipedia again). The Poisson distribution has the nice property that the mean and the variance are both equal to λ. The variance gives us a measure of the width of the distribution, or in other words, the uncertainty in our sampled estimate.
Now we can make one further simplification. If the the number of samples M is "large," then the Poisson distribution for k is well-approximated by a normal distribution, retaining the mean value (λ) and the variance (also λ). It turns out that in some of our cases the number of samples is not really large enough to completely justify this assumption, but let's go with it — this is rough work anyway. Now we really can work on the back of the envelope — we can say that the "one-sigma" uncertainty on the doping rate is equal to the square root of the number of positive tests, divided by the number of tests.
Figure 1
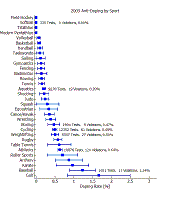
Figure 1 — 2003 positive doping test rates by sport (click to enlarge).
So for Golf (4 positive tests out of 240), the estimated doping rate is (1.67 ± 0.83)%, whereas for Athletics (120 positive tests out of 18,876), the estimated doping rate would be (0.64 ± 0.06)%;. Here the ± covers the one-sigma uncertainty, which is a roughly 68% confidence interval; to get a 95% confidence interval we could just double the uncertainty.
Figure 1 (inset) shows the estimated doping rates for 2003, including uncertainty, for 32 of the 33 sports (FIFA, which governs Olympic soccer, reported the largest number of tests (20,104) but did not reveal the number of violations). As you can see, the non-Olympic sports generally did not perform a large number of tests, and so their doping rate estimates are very uncertain. Other sports with high but uncertain positive test rates are Baseball, Archery, and Table Tennis. In fact, all of the truly susprising results have relatively large error bars, which tends to support the idea that the results are more due to random chance than any underlying truth.
Speaking of truth, of course we can't translate the positive test rate into a real doping rate unless we believe in the tests themselves. If the tests have a high probability of detection (near 100%), and a low probability of false alarm (near zero), then these numbers are realistic estimates of the incidence of doping among high-performance athletes. Otherwise, false positives and missed detections muddy the picture considerably. Some people will see this graph as evidence that overall doping rates are extremely low; others will conclude that the tests don't work. I've made a few arguments on this topic before, but I know I won't convince everybody, and I don't think we're ever going to know the objective truth.


No comments:
Post a Comment