Last September I wrote about the statistics of anti-doping tests. More recently WADA released the statistics for out-of-competition tests they conducted in 2005. As I noted at that time, there was a statistically significant rise in the percentage of positive tests in 2005 compared to 2004.
Last month, WADA released their annual report covering all tests conducted by WADA-accredited labs. That includes all in-competition and out-of-competition tests conducted by the various IFs, as well as those conducted by WADA directly. That's a huge number of tests, and the archives include detailed results for 2003 and 2004 as well. I'm going to spend a couple of posts looking at these numbers in more detail.
In Figure 1 (inset), I have plotted the positive test rate (number of positive tests divided by the total number of tests). The results are shown for each of the three years for all Olympic sports, and the five summer sports that are on the "short list" for inclusion in the Olympics. The total number of tests was more than 145,000 in 2005.
Figures
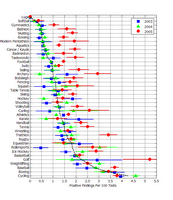
Figure 1 — positive test rates at WADA-accredited labs in 2003, 2004, and 2005 (click to enlarge).
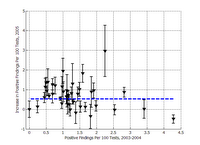
Figure 2 — changes in the positive test rate in 2005 compared to the average for 2003-04 (click to enlarge).
Back in September I discussed how the sample size (number of tests) can be used to estimate the uncertainty in the measurement. Similar error bars are shown in Figure 1.
At the time I explained that calculation, I sort of glossed over the meaning of those error bars. I'm going to talk about changes in positive test rates, and in the next part of this post I'm going to speculate about reasons why those test rates changed in 2005, so I should be a bit more careful about that point here. What the error bars represent is the statistical distribution of positive test rates that you would measure if you repeated the ensemble of tests many times using different (but equivalent) random samples of athletes. If the tests don't change, and the behaviour of the athletes doesn't change, then the error bars should also represent the year-to-year variation in positive test rates.
As was the case with the much smaller sample I discussed in April, there was a statitsically significant increase in the positive test rate in 2005 compared to 2004 and 2003. The overall rate, averaged for the 40 sports, was (1.51 ± 0.36)% in 2003, (1.67 ± 0.35)% in 2004, and (2.10 ± 0.38)% in 2005.
It's also interesting to look at the increase on a sport-by-sport basis. Figure 1 demonstrates that the increase is roughly constant for all sports, although there are of course some exceptions. Figure 2 explores this in a little bit more detail, showing the difference between the 2005 positive test rate and the average of the 2003-04 positive test rates. Where the change is positive — as most of them are — it indicates more positive tests in 2005. The blue dashed line is the average change, which is 0.53%. When we take the error bars into account, the changes are consistent with the assumption that the positive test rate has increased uniformly for all sports.
If you squint, you might even convince yourself that the increase has been greatest for sports with low positive test rates, and less for sports with the highest catch rates. In the next part of this post, I'll talk a little bit more about what kinds of changes might lead to that kind of distribution.
Speaking of sports with high positive test rates, something struck me when I was comparing the 2003 results from my September post to the 2003 curve from this post. Namely, the 2003 rates reported by WADA are significantly higher than those reported by the IFs for the IOC report that was the basis of my earlier post. This is true across the board, but I particularly noticed cycling and triathlon.
Cycling was, by WADA's measure, the dirtiest of all 40 sports in 2003, with 486 positive tests out of 12,352 total (3.93%). In the IOC report, the UCI noted a total of 61 positives out of 12,352 tests (0.49%). The ITU similarly reported no positives out of 1664, whereas WADA's accredited labs counted 23 positives.
So what gives? It turns out there's a subtle difference in what's being reported. The IOC report counts "Number of tests reported that resulted in anti-doping rule violations," whereas WADA counts "A sample adverse analytical findings." The WADA reports footnote that fact, stating:
These figures may not to be [sic] identical to sanctioned cases, as the figures given in this report may contain findings that underwent the Therapeutic Use Exemption (TUE) approval process. In addition, some adverse analytical findings also correspond to multiple measurements performed on the same athlete, in the case of longitudinal studies on testosterone.
This of course leads to a natural consideration of false positives, which I will also touch on in the next part of this post. But there's an interesting piece of data in the WADA results that sheds some light on the issue. The sport of Luge has not had a single positive test in three years (458 tests). This lets us put an upper bound on the false positive rate — the probability that an innocent athlete will have an adverse analytical finding by random chance. Based on the results from luge over the past few years, it can't be much more than 1 in 500 or 0.2%. Of course, if it's really that high I would be pretty dismayed — that would mean that about 290 tests (0.002 × 145000) were false positives in 2005 alone.


No comments:
Post a Comment