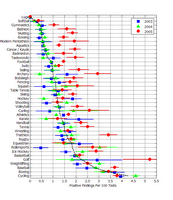
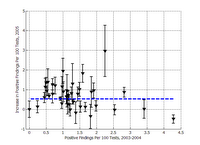
In Part 2 of this post, I discussed the statistics of anti-doping tests conducted by WADA from 2003 to 2005. Specifically, I showed the positive test rates for 2003, 2004, and 2005 for all summer and winter Olympic sports, plus a few selected other sports. As I noted in that post, there was a significant increase in the positive test rate in 2005 compared to the previous two-year period. In the first part of this discussion, which was several months ago, I discussed WADA's publicly-stated hypothesis that the year-over-year increase was due to an increase in the effectiveness of their testing, and not due to an increase in the rate of cheating.
In this post, I want to explore the statistics of the increase in more detail. My goal here is to provide a crude test of the hypothesis that the effectiveness of anti-doping programs increased between 2004 and 2005.
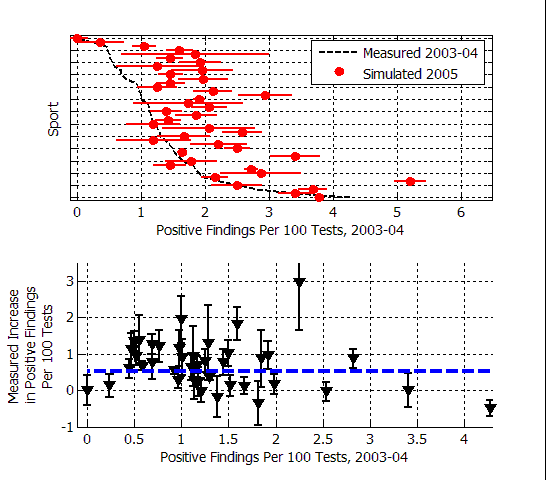
The figure above shows some of the key data summarizing that increase. The upper plot shows the positive test rates for the period 2003-2004, and for 2005, for all of the sports. The sports are arrayed on the vertical axis, although the names are not shown in this plot — see Figure 1 from Part 2 for more detail. The positive test rate, defined here as the number of A-sample adverse analytical findings divided by the total number of tests, is displayed on the horizontal axis. The error bars on the positive test rate are calculated on the basis of the total number of tests performed. Large error bars mean there were few tests performed, and small error bars mean that there were many tests (see this post for details).
The lower plot shows the change in the positive test rate (2005 rate minus the 2003-04 rate) plotted as a function of the 2003-04 positive test rate. As I noted last time, the curve is consistent with the hypothesis that the increase is the same for all sports, having a mean value of 0.53%.
Now it is interesting to note that almost all of this 0.53% increase can be attributed to a single banned substance: testosterone. The number of adverse analytical findings for testosterone in 2004, in all sports, was 392. The number of adverse analytical findings for testosterone in 2005, in all sports, was 1132. An increase of 740 positive tests, out of 146,539 total tests, would result in an increase in the positive test rate of 0.50%. That's an interesting coincidence.
It also turns out that the test for testosterone was changed between 2004 and 2005. Specifically, the threshold for the testosterone test was lowered:
The 2005 figures include several elevated T/E ratios [a urine parameter used in anti-drug tests] over 4, which were not reported in previous years when the threshold was 6, partially accounting for the increased number of AAFs in 2005. (source, PDF)
Now, lowering your failure threshhold is guaranteed to accomplish two things: it will increase your probability of detecting cheaters, and it will increase your probability of "catching" innocent athletes by mistake. The degree of each change will depend on how many cheaters are below the current threshhold, and how many non-cheaters are above the new one. To be honest, I don't know the details of those distributions, but the observations we do have (provided by WADA) might be of some help in assessing the change. I don't have the testing breakdown by sport by substance, so I'll have to look at the global data for all banned substances.
To quantify this a little bit further, I'll assume that within each sport, a fraction DS of the population of tested athletes are using banned substances, where DS is different for each sport. I'll assume that when one of those cheating athletes is tested, there is a probability Pd (the probability of detection) that the test will give an adverse analytical finding, and that Pd is the same for all forty sports. (In other words, drug testing, overall, is equally effective in all sports. I don't think that's really true, but I'll do my best to gloss over that fact when I'm finished.) Finally, I'll assume that when any athlete (clean or dirty) in any sport is tested, there is a probability Pfp that the test will generate a false positive.
Under these assumptions, when N athletes are tested, the expected number of positive tests will be given by:
A = N (Pfp + Pd DS) ,
and the positive test rate will be simply A/N. Since we're talking about positive tests for all banned substances combined, the probabilities and rates in the equation above have to be averaged over all banned substances as well.
I've run some simulations using this equation to try to estimate the effect of changing the probabilities Pd and Pfp. I set N equal to the number of tests actually performed, using the 2005 numbers as a basis, and then ran multiple Monte Carlo simulations to estimate the statistics of the distribution of the number A of observed positives. The underlying doping rates DS are unknown, but once the values of Pd and Pfp are specified, then the doping rates have to be set to match the observed positive test rates for 2003-04; from there I can simulate the effect of changing either Pd, or Pfp, or both, while holding the DS fixed.
If drug testing was more effective in 2005 than it was in 2004, I can model that as an increase in Pd for all sports. To make things simple, I'll assume for the moment that the probability of false positives is zero. I don't really have any idea what to use as the value for Pd in 2003-04, but for starters I'll assume that the probability of catching a doping athlete with a drug test was 25%.
If that probability increased to 36.5% in 2005, then the simulated positive test rates would be as shown in the figure below:
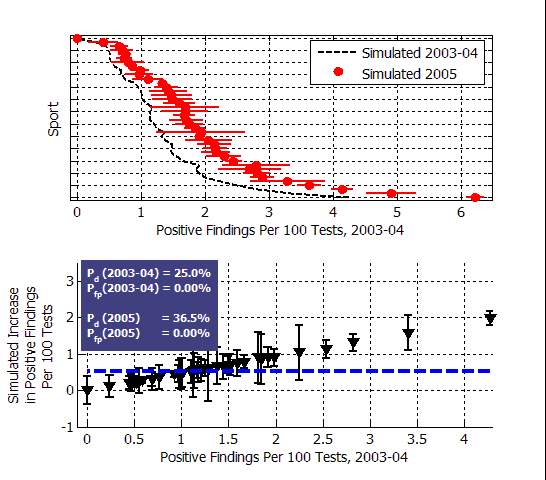
The upper plot shows the simulated positive test rates for the two proposed values of Pd, where the doping rates DS are set to match the 2003-04 observations, and then held constant for the 2005 simulation. The error bars on the positive test rates indicate the standard deviations of the Monte Carlo runs, and the red circles indicate the means.
The increase in Pd was chosen to match the mean observed increase of 0.53% in all sports, indicated by the dashed blue line on the lower plot. The same result is obtained from any similar proportional change in the probability of detection. In other words, an increase from 25% to 36.5% looks exactly the same as an increase from 65% to 95%, or from 10% to 14.5%.
As you can see, if the probability of detection is increased for all sports, then the greatest increase in the positive test rate should be in sports with the highest positive test rates, and the sports with very low positive test rates show the smallest increase. The expected increase is proportional to the initial positive test rate. That doesn't actually match the observed changes very well. In general the sports with the highest positive test rates showed little or no change in 2005 compared to 2003-04.
But what if, instead of increasing Pd, we simulated an increase in Pfp, the false positive rate? Then the picture looks quite different:
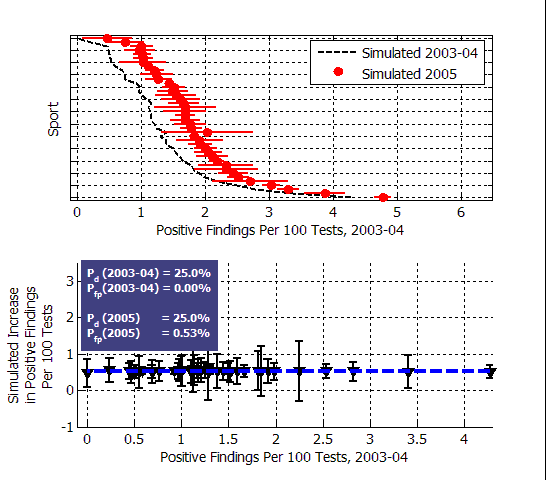
The figure above shows the effect of increasing the false positive rate in all sports from zero to 0.53%. In this case, the positive test rate is increased uniformly for all sports, regardless of the underlying doping rate. (I used a probability of detection of 25% for the simulation, but that parameter turns out to be irrelevant to the increase.)
Modelling the 2005 increase as an increase in the false positive rate looks like it matches the observations quite a bit better than an increase in the detection rate. Given the sample uncertainty, as I stated at the outset of this post, the observed increase is consistent with a uniform change in all sports.
One small problem with this theory is that the postulated false positive rate is pretty high. If Pfp = 0.0053 for all sports in 2005, then that should set a lower threshold on the observed positive test rates. Both luge (0%) and softball (0.37%) came in under the limit in 2005, but the number of tests involved was very small. With 178 tests in luge, we would have expected 0.94 positive tests, whereas none were observed. In softball, 542 tests should lead to 2.87 positives, whereas two were observed. So we're talking about less than one "missing" positive test in each case — I don't think we can rule out a false positive rate of 0.53% quite yet, and I think we have to at least consider the possibility that the false positive rate increased significantly in 2005.
Of course the assumptions I've used in my analysis are pretty simplistic; certainly all sports don't have the same kind of doping problem, and therefore their anti-doping programs are not all the same either. But my conclusions are based on a comparison of broad trends, and don't really depend critically on that assumption, I don't think. For a future analysis, it would be really nice if I could study the positive test rate changes for testosterone by itself, since I think that the increase in positive test rates was largely due to the changes in the testosterone test. Unfortunately, WADA doesn't provide that breakdown.
Some people might also reject my very first assumption, which was that athlete behaviour (specifically doping rates) didn't change between 2004 and 2005. What if they did change? Well, assuming that the tests were consistent from year to year, the observed changes in positive test rates suggest that the rate of doping increased more or less uniformly across the board. I can't really tell the difference between that event and a change in the false positive rate.
I have to live with the limitations of the analysis, which means that there's no "smoking gun" here. But everything I've looked at in the 2003-2005 statistics suggests that the increase in the positive test rate in 2005 came largely at the expense of athletes that weren't cheating in the first place.


